Integrated Financial Training: Westchester NY |
|
Empowering you to Manage your Money and your Happiness |
|

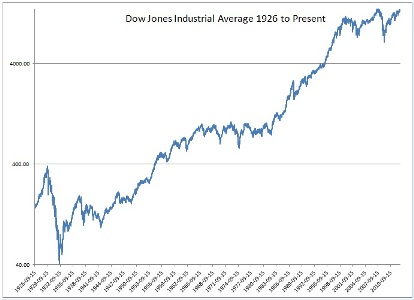
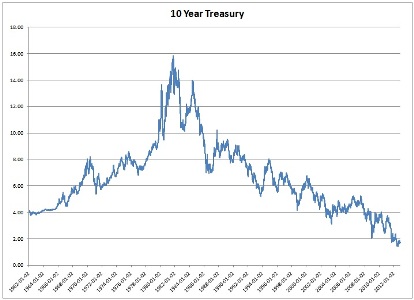
My father, a pilot, once explained that most plane crashes could be avoided if only the pilot looked out the window instead of gazing at his instruments. When steering our retirement, we want to look out the window... Summary The financial management process is extraordinarily complex and so this discussion will be more challenging for some. In order to discern the underlying principle techniques, professors invariably make simplifying assumptions. But what happens if the assumptions bring you so far from reality that their recommendations are no longer useful? To be effective, we need our reactions to be rooted in reality, not theories without real world application. Otherwise it is like learning to walk when you only have one leg but assume you have two because it is simpler to model. If you keep trying to put your weight on the second leg, you will keep falling down. Financial planning calculators often do not measure how our assets match up to specific expenses in the future. Some assume financial returns are far safer than they have proven to be in the past. Some people feel the risk in stocks fall over time and so over emphasize them in a plan. A case study using ESPlanner showed that investment risk can be reduced to better match one's expenses. Instead other efficiencies in IRAs, Social Security and lifestyle could replace the assumed benefit of the additional returns from stocks. ESPlanner is one of the better tools to perform a financial plan, which is critical to assuring security in retirement. A couple of issues are outstanding with the software, such as making sure you use conservative estimates of returns, consider the timing of the returns and understand that the program does understate the risk level to some degree. Another free program (prospercuity.com) is less comprehensive but covers some of the weaknesses of ESPlanner. Failing to perform this sort of analysis is a critical error in securing your retirement. The majority of your time in preparing your financial decisions should be spent here. Managing Investment Risk Risk models typically assume financial returns are normally or log normally distributed. These terms might bring back memories in school where we learned about the Bell Curve. But for many years financial professionals have known that returns produce far more high risk events than these distributions would predict. So if you are managing risk and are concerned about large losses, why would you assume large losses are far less likely to occur than they have proven to be historically? Also, these distributions assume returns from one period to another are independent of each other. But simply inspecting Chart 1 of the long run log based price history (adjusts left hand scale so same percentage price increase goes in straight line) of stocks or Chart 2 of interest rate movements may tell a different story. Do you get the feeling there are any long term trending patterns or reversion to a mean? While academia struggles to prove this one way or the other mathematically, common sense dictates we should be on the lookout for these problems.
Changes in the distributions of returns can impact our lives in unexpected ways. This can result in unusual returns persisting for longer periods of time that the models predict. Also, many people who analyze risk stop looking after finding the probability of a return that is below a target rate because they don't think they have to. Well, how much below? If I lose 10% or 100% of my money, would that make a difference to me? Extreme events have been more common than forecast. There have been some forays into the region of modeling return patterns by more closely approximating the distribution of financial returns. [1] Additionally there are some important idiosyncrasies in how some have looked at investment returns. Professor Zvi Bodie has done some interesting work in highlighting what he feels are some misconceptions from the financial press on the riskiness of stocks.[2] Many openly advocate investing in stocks due to their reduced risk over the long run. But if the risk actually fell over time, the cost to insure the risk would fall as well. The problem is the cost to insure the risk clearly rises. Others try to optimize a portfolio versus the returns of Treasury Bills as a risk free alternative. The problem is our actual need is to match inflation to insure we maintain the purchasing power of our money. So when you use the wrong low risk asset, you avoid assets with decent returns that actually protect you better from what you will experience as a loss in favor of assets you will experience as swinging wildly with lower returns. Not everyone who develops a financial planning calculator considers these factors, and some of them can have a material impact on our situation. We need to take a more balanced view. Our simple case study used a combination of historical returns and some simulations based upon the somewhat inaccurate log normal distribution to get a sense for risk. We tested scenarios from 41 years of historical data (bond market returns were constructed to cover the total period) complete with three major stock market implosions, long periods of stock under performance and then long periods of stellar performance, spiraling inflation and disinflation, interest rate shocks, a 20+ year bond market rally and international financial crisis. Using actual historical scenarios corrects the problems of inaccurate distributions, incorrect assumptions regarding long term risk and dependence from one period to the next. But the number of scenarios is limited. So we used the Monte Carlo Simulation as a balance. A key component of our analysis was to measure investment returns versus the potential loss of purchasing power, which makes instruments such as TIPs among the lowest risk assets. The purpose is to find a balanced portfolio best able to maintain positive returns vs... inflation in a variety of circumstances. This approach eliminates the problem of eschewing assets with reasonable returns that have very low risk relative to our actual expenses as adjusted for inflation and favoring higher risk assets with lower returns. Combining all of these factors helped us identify that the 60/40 mix of stocks/bonds posed a serious risk to this couple which could easily result in the panic reaction and loss of lifestyle going into retirement. Knowing this risk lead them to the search for healthier solutions which avoided the panic response and enabled them to largely maintain their lifestyle. If this analysis were very expensive of difficult to complete, perhaps the information would not be worth it. Fortunately, such is not the case. And once the analysis is set up the first time, you can re-run it easily any time your circumstances change. If you are a pilot, you need to be educated on how to use your instruments. But hopefully, no one needs to teach you how to look out the window. If you've made it this far, please email us feedback - tell us what you think and if there is any way to be more helpful. Legal - The purpose of this site and all services offered are educational in nature and not to provide any investment advice, planning or recommendations of any securities. The purpose is to educate you to make your own financial decisions, or prepare you to evaluate your financial advisors with confidence so you can gain trust in the services they provide.
[1] The Impact of Skewness and Fat Tails on the Asset Allocation Decision, FAJ Mar/Apr 2011 [2] The Long-Run Risk of Stock Market Investing: Is Equity Investing Hazardous to Your Client’s Wealth?, FAJ 2011
|
Integrated Financial Education: Westchester NY - 168 Bell Rd, Scarsdale, NY 19583 914-648-0492


