Integrated Financial Training: Westchester NY |
|
Empowering you to Manage your Money and your Happiness |
|

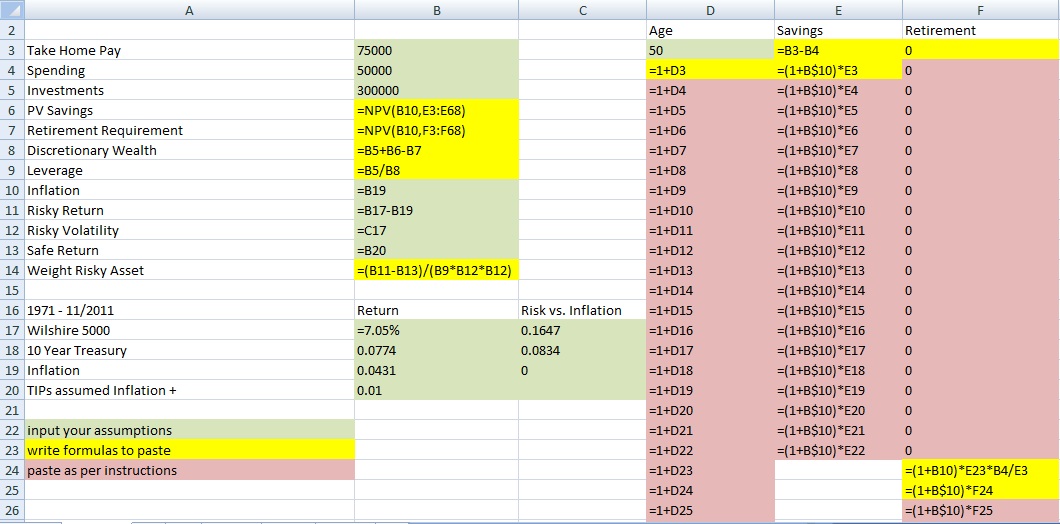
Genuine wealth is being happy with what you have. Real poverty is always wanting more... When greed infiltrates the financial decisions we make, serious problems can follow. So the question is how much of our assets should we put at risk in the stock market and why? Jarrod Wilcox developed a simple and intuitive model, the Discretionary Wealth Approach (DW), to answer this question. If one barely has enough to survive in retirement, risking those assets to gain more is quite dangerous and unnecessary. However, if one has more than enough and can afford to lose some if events turn sour, then taking risk to increase wealth can be a good idea. With more wealth, we can take on more responsibility for good works during our lifetime. So we remain actively engaged in the world, responding to circumstances properly. At the same time our minds are unmoved by greed or selfishness. Other articles explained that the asset allocation decision is the single most important investment decision we will make. Here we will show how to construct an extremely simple spreadsheet based upon the Discretionary Wealth Approach so you can take a preliminary look at your personal situation. Bear in mind this version of the model is too simple to create a reliable answer for your personal planning purposes. Instead, the purpose is educational and to provoke important questions that you might ask your adviser (if you have one) to make sure you are on track. Prerequisites are Excel 2007 or better and the ability to type the simple formulas shown below into 10 cells in the spreadsheet and do a little copy and paste. Then we show a typical example using the last 40 years of financial history and compare the DW approach with the conventional planning models. The industry standard approach to asset allocation is based upon modern portfolio theory, where risk tolerance is often addressed through a survey of your emotional reactions to market fluctuations. No one really knows what to do with utility theory in modern portfolio theory, so that measure of risk tolerance is normally discarded. The process is heavily impacted by rules of thumb such as invest a proportion in stocks equal to (100 - your age) or (120 - age). No direct relationship to your financial position is specified in the model. Jarrod Wilcox felt this approach was not managed properly and developed a very intuitive means to customize risk tolerance to each individual's circumstance. The idea is that people should not take risk when they cannot afford to lose. If they can afford to lose, taking risk may enable them to build wealth to achieve positive works beyond merely paying their bills. So he first figured out what someone needs to survive in retirement and whether or not their future savings plus current investments are enough. If there is a surplus, termed discretionary wealth, some risk can be taken. Then he showed how to maximize wealth after retirement expenses are considered. Our simple example will use two assets, one risky (stocks - or it could be a mutual fund with say 20% bonds and 80% stocks) and one risk free (Series I inflation protected savings bonds). We take a typical 50 year old and indiscriminantly used the past 40 years or so of financial data (1/1971 to 11/2011 care of FRB of St Louis). The question is framed by our assumptions of future returns: what proportion should we invest in each? Secondarily, we will compare the results with the industry rules of thumb to see if they suggest we maximize our wealth based upon what we can really afford to risk. If so, the proportions should be similar. We will do so by creating a spreadsheet which you can easily customize to your personal situation. Note the formulas in the cells in yellow and the instructions below:
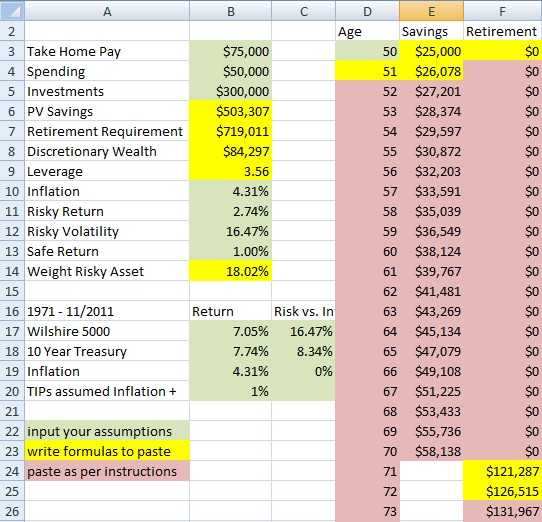
To construct this spread sheet, all you really need to worry about are the cells in yellow. There are 10 cells where you just type the formulas as shown in the precise cells where they are located. (The $ signs in the formula are important when you copy through a column of cells, so make sure you include them. Also note the spreadsheet is show starting at row 2.). Then for the red cells, just copy what is in the yellow cell on top of it and paste down the column as you can see. For this person, they began at age 50, so at cell D23 (age 70), they retired. So from D24 down they had no savings from earnings. But they did need to draw funds from their investments starting E24. You copy cell E25 downwards until they are assumed to pass away. Make sure to put the zeros in the retirement column when you are still working and saving or the npv formula in B7 will be wrong. When you are done, test your spreadsheet to make sure you get the same answers as below. At this point, the spread sheet is constructed. All you need to do is put in your assumptions. How much do you earn after taxes and what do you spend? How much do you have for investments? You can make assumptions for returns and inflation. They can be placed in cell B10-B13. Using roughly the past 40 years of data for a typical 50 year old, the results are as follows:
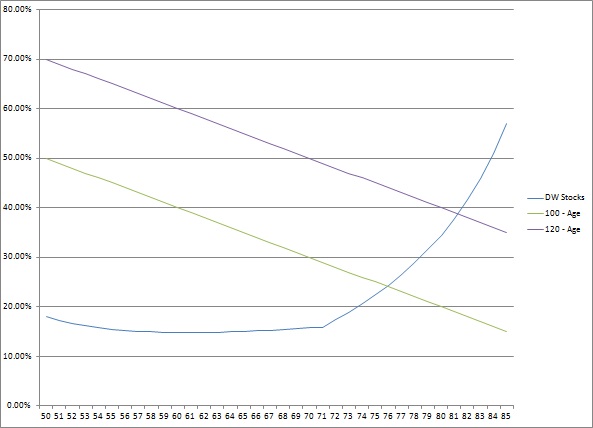
Starting in cells B16 are shown the returns for the Wilshire 5000 stock index with dividends from 1/1971 to 11/2011. Also shown are the returns for 10 year treasury notes assuming you purchased them each month and then sold them the next month to buy the next new bond. No transaction costs were assumed. The volatility shown is the standard deviation of stock returns. Investing in say Series I savings bonds as a risk free asset which provide a return equal to inflation plus a return insures we are able to pay for our expenses after they are eroded by inflation. As this product did not exist during the entire 40 year period, we made a normal assumption that the return on the risk free asset is lower than for a risky asset. In this period the assumption is unlikely to be true, but we are drawing a comparison to the conventional models and thus need to use similar assumptions. One should note that many in the financial industry are not aware that returns on stocks have been lower than for bonds over periods in excess of 30 years. During this 40 year period, stocks returned 7.05% to bonds 7.74%. Higher yielding bonds than treasuries may have done better. Given the lower risk of bonds, they would clearly be the better choice as a risky asset for this analysis, but we will stick with stocks to draw the comparison to conventional planning. This 50 year old can have up to 18% in stocks with an weighted portfolio return of 5.62%. (Note the results would show an allocation of 98% for bonds with a higher portfolio return of 7.70%.) Let's compare the asset allocation for this individual with the industry rules of thumb which suggest the proportion in stocks should be around (100 - one's age) or (120 - age):
As you can see, the industry rules of thumb suggest a heavy allocation to stocks early on, declining as retirement approaches. The discretionary wealth approach suggests allocation to stocks should be much lower, but increasing with age during the retirement years. This phenomena occurs because one's asset base begins to substantially increase over the cost of retirement such that one can afford to take more risk. The DW approach is designed to maximize your wealth after you secure your retirement expenses. The industry standard rules of thumb are obviously not doing the same thing. Using the (100 - age) rule would have lead to a residual wealth of $445k after retirement expenses, while taking a great deal of risk. However, if TIPs were used as the risk free asset and their returns were similar to the bonds here, the residual wealth using DW would have been $1,202k on a completely risk free basis. Obviously the future is unlikely to be precisely the same as the past, but it certainly brings forward some good questions. There are some very important caveats which suggest you should not use this model alone to guide your allocation. The model is similar in depth to some generic models used in conventional planning, but making personal decisions requires more thought. For example, all assets are assumed to be in Roth IRAs, no pensions or Social Security income are assumed, owning a home and how it is financed is not considered, the ability to trade down in house during retirement is not used, living longer can produce substantial changes, and extreme events are not projected to happen as often as they do, risk was not measured against inflation which can be important when considering a number of assets including TIPs. The model has more advanced versions which can address all of these questions, but it requires a professional level of skill to program it for yourself. Use of models such as ESPlanner can cover the same ground if used properly. So in the end we should manage our affairs without motivation from greed. We will then act with prudence when in danger and take risk to make a stronger positive imprint on the world around us when we can. Using models designed with the same motivations can help us align our actions with these positive sentiments. Legal - The purpose of this site and all services offered are educational in nature and not to provide any investment advice, planning or recommendations of any securities. The purpose is to educate you to make your own financial decisions, or prepare you to evaluate your financial advisors with confidence so you can gain trust in the services they provide. |
Integrated Financial Education: Westchester NY - 168 Bell Rd, Scarsdale, NY 19583 914-648-0492


